
How to combine statements into a table
Bank statements are often available only as PDFs — especially when you download past periods or work with multiple banks. When you need to combine statements for a month or a quarter, manually transferring hundreds of rows is slow, tedious, and it’s very easy to make mistakes with amounts or dates.
PDF to Google Sheets helps turn bank statements into a clean list of transactions you can actually work with in Google Sheets: filter, review, build reports, and prepare data for your accountant.
What usually breaks in PDF bank statements
- each bank uses its own table layout and column names
- amounts may use commas, dots, or spaces as separators
- dates come in different formats
- columns shift when the statement spans multiple pages
- some statements are scans, and without OCR the data can’t be extracted
Why business owners combine statements into a single table

A bank statement is essentially your real cash “log.” When all transactions are in one place, you can:
- quickly see how much is actually spent on fees, services, and subscriptions
- spot duplicate payments or suspicious charges
- calculate expenses by category (marketing, salaries, rent, etc.)
- understand cash flow gaps: when money comes in and when it goes out
How to organize the table after conversion
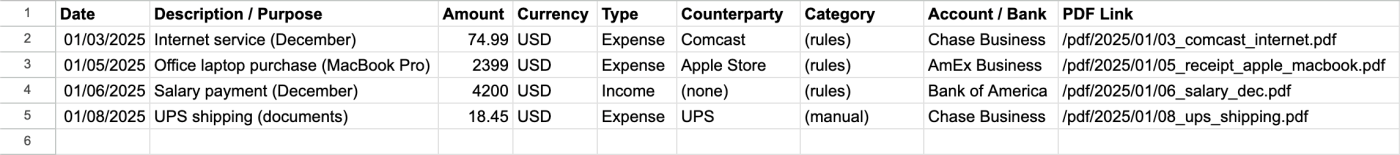
After importing, it’s useful to bring the data into a simple template. In most cases, these columns are enough:
- Date
- Description / Purpose
- Amount
- Currency
- Type (income / expense)
- Counterparty (if available)
- Category (added manually or via rules)
- Account / Bank
- Link to the PDF
The key idea is that data from different banks should fit into the same columns. That way, you can combine everything like building blocks instead of dealing with a new format every time.
A quick check after import (takes 1 minute)
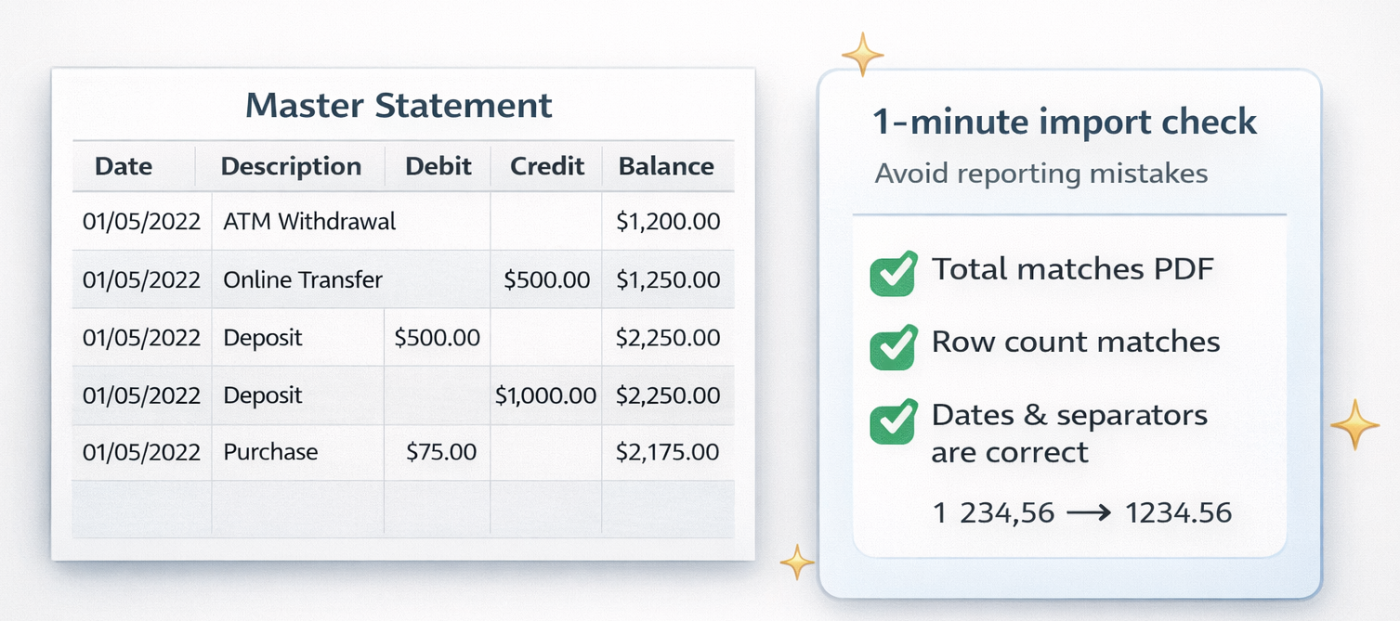
To avoid errors in reports, it’s enough to check three things:
- Does the total amount for the period match the total shown in the PDF (if the statement includes one)?
- Did negative values or separators break (for example, 1 234,56 turning into 123456)?
- Does the number of rows match the statement, especially if it has many pages?
What you can do next in Google Sheets
Once all transactions are in one list, it’s easy to build:
- an “income vs expenses by category” report
- a list of recurring payments (subscriptions, rent, services)
- a weekly cash flow chart
- a “top 10 counterparties by spending” table
And most importantly — if you do this regularly, it becomes a simple, repeatable process: export the PDF → convert it → update the master table → see the full picture of your finances.